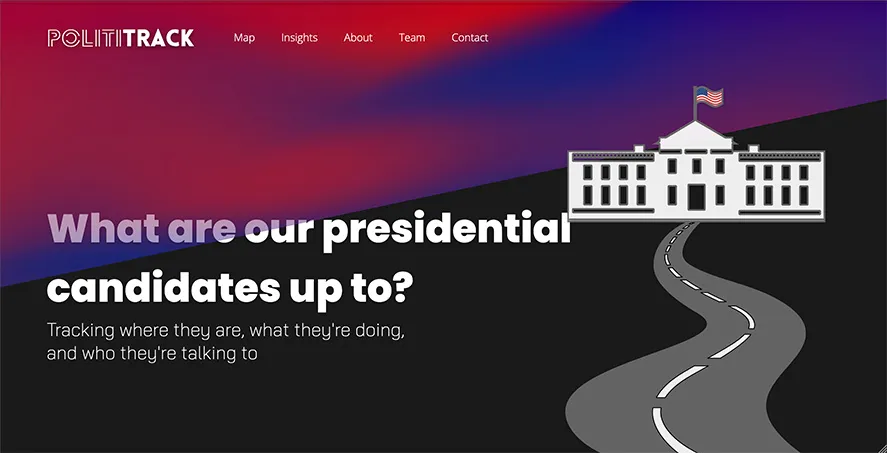
Polititrack
A web app that tracked polling and candidate movements for the 2020 presidential election.
The Problem
During the 2020 presidential election cycle, polling data was published across multiple outlets with varying methodologies and update schedules. Tracking real-time polling trends, understanding candidate movements, and seeing how different demographic groups were shifting over time required navigating fragmented data sources. There was no single platform that aggregated and visualized this information in an accessible way.
My Role
I developed Polititrack as a real-time election monitoring application. I built the data pipeline that ingested polling data from multiple sources, created dynamic visualizations that updated as new polls were released, and designed a clean interface that made complex polling data understandable for users ranging from political enthusiasts to casual observers.
Tech Stack
-
React: The reactive nature of React was ideal for building a dashboard that needed to update in real-time as new polling data arrived. Component reusability allowed for consistent UI patterns across different data views.
-
D3.js: Essential for creating the interactive election visualizations — from trend lines showing candidate movement over time to maps displaying polling by region. D3’s flexibility allowed me to build custom visualizations that communicated complex electoral concepts clearly.
-
Node.js: Handled the backend API and data processing pipeline. Node’s event-driven architecture was perfect for managing frequent polling updates and serving data to multiple concurrent users without performance issues.
Key Features
-
Real-Time Poll Tracking: Polling and appearances data collected through manual data entry from multiple sources throughout the 2020 election primary cycle.
-
Trend Visualization: Interactive US map showing polling numbers and political appearances for major candidates, with the unique ability to “play” the election back day over day and scrub forward/backward to any specific date.
-
Demographic Analysis: View polling data filtered by different regions and demographic breakdowns.
-
Historical Comparison: Track how polling and candidate movements evolved throughout the primary cycle.
Lessons Learned
Building Polititrack taught me about the challenges of working with real-time data and the importance of managing manual data collection workflows. While the project was valuable for the 2020 election cycle, I learned that automated data pipelines would be essential for scaling this type of application beyond a one-time event.
I also learned that giving users the ability to explore data through time — watching the election change day by day and scrubbing to specific moments — created an engaging experience that made complex polling patterns intuitive and accessible.